If you are tracking national real estate headlines on platforms like Inman, you’ve likely seen a lot of talk about the housing market settling into its most "balanced" state in nearly a decade.
But anyone operating on the ground knows that broad national trends rarely tell the full story. To understand what is actually happening in the Savannah Lowcountry right now, we have to look past the surface numbers and talk about the real human factors driving our local market.
Here is the data-backed reality of how our local market performed in the second quarter of 2026, and what it actually means for buyers and sellers across Coastal Georgia.
The Q2 "Spring Rush" Was Actually Pent-Up Frustration
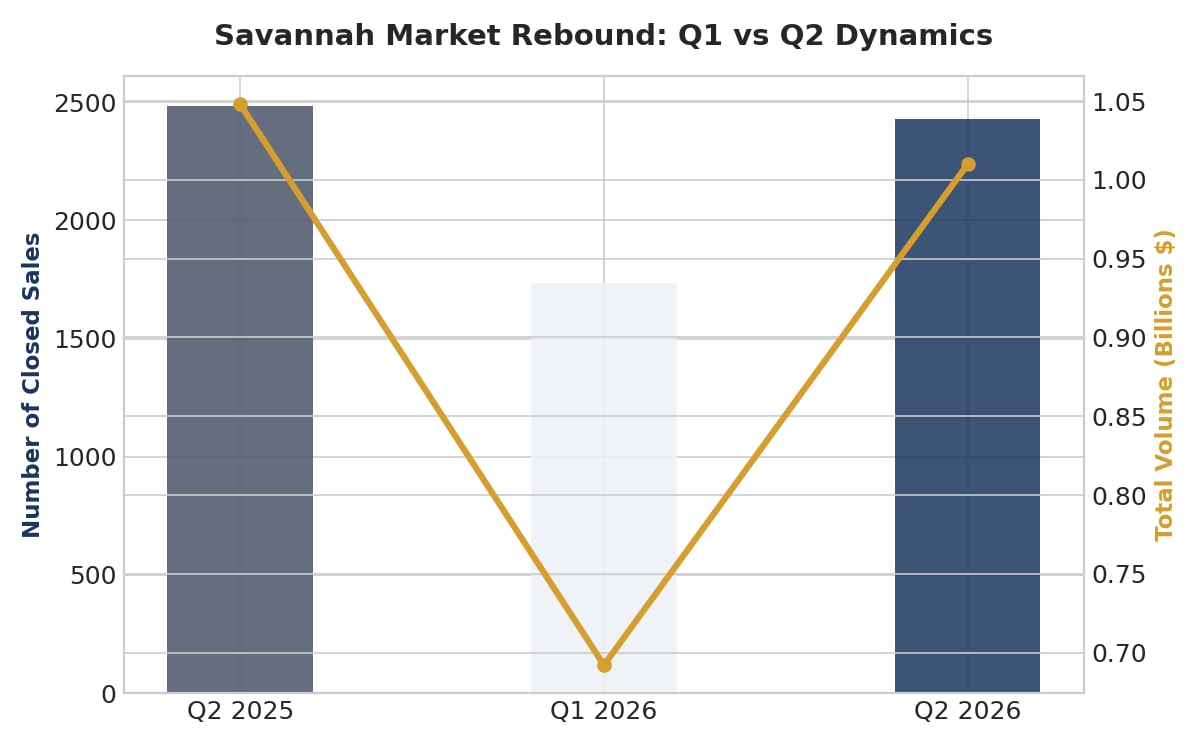
Looking strictly at the raw transaction numbers, Q2 looks like a massive explosion of buyer activity. Closed sales in the Savannah area surged by 39.9% quarter-over-quarter, jumping from 1,735 completed transactions in Q1 up to 2,427 in Q2.
Total sales volume rebounded right along with it, climbing 45.9% to hit $1.01 Billion for the quarter.
Turnkey is King: The Reality of the 5.4% Price Tick
This sudden concentration of buyer demand did pull our local median close price up 5.4% quarter-over-quarter, moving from $327,329 in Q1 to $344,900 in Q2.
The Reality on the Ground: That price increase is entirely concentrated in one specific category: turnkey homes.
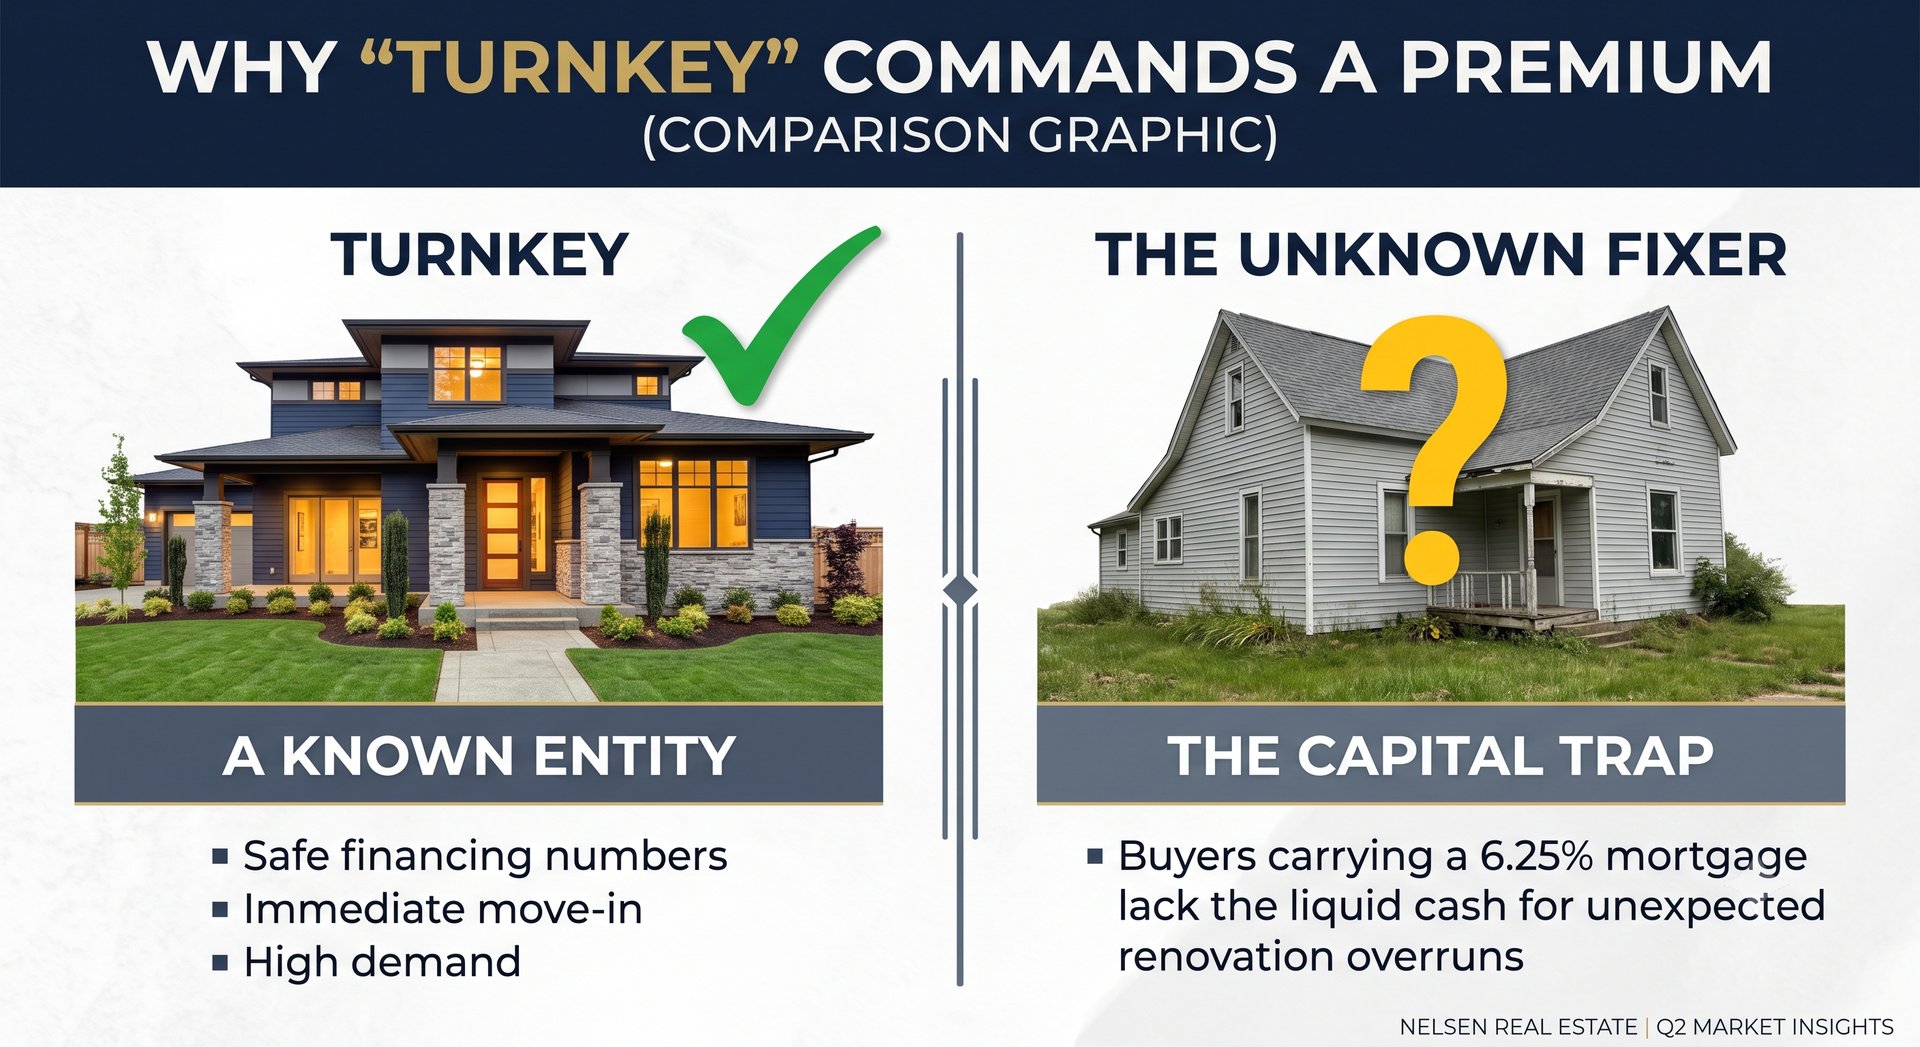
With mortgage rates stubbornly hovering between 6.0% and 6.25%, local buyers are completely exhausted after making their down payments and covering their borrowing costs. They simply do not have the extra liquid cash required to take on a project. Move-in-ready homes are selling quickly because they represent a known financial entity. Conversely, any property with an "unknown" renovation budget or immediate structural need is being left on the sidelines. In 2026, certainty commands a premium.
The 57-Day Sweet Spot: Sane Timelines Return
Our local median days on market (DOM) dropped from a winter average of 67 days down to 57 days in Q2.
The Reality on the Ground: While sellers who remember the hyper-speed, weekend-flip markets of recent years might find a nearly two-month timeline alarming, this is actually a remarkably healthy cadence.
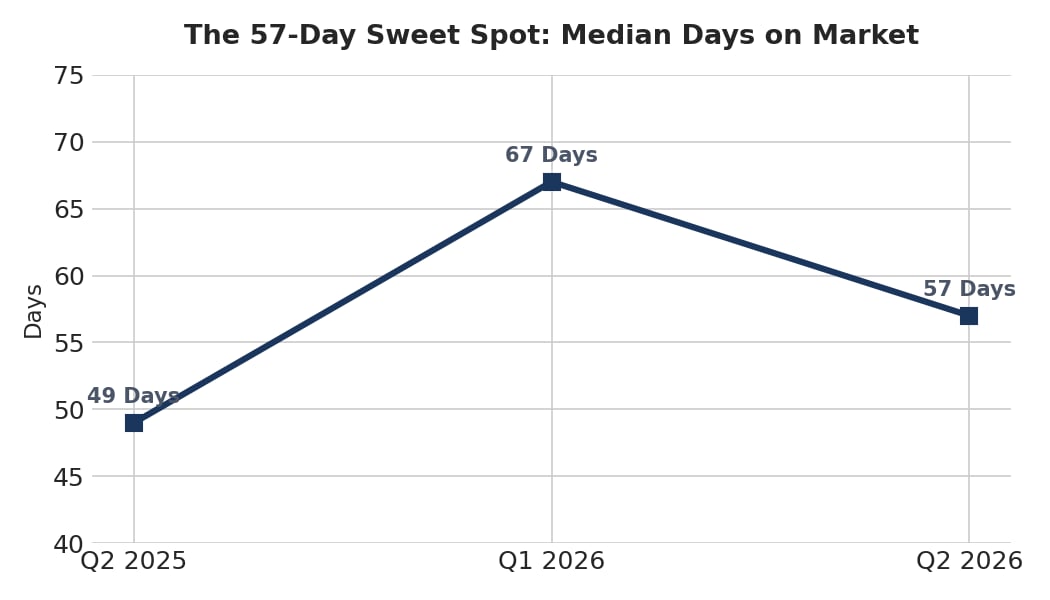
What we are seeing on the ground is a predictable, realistic pace: properly priced, well-presented homes are getting immediate showings and solid offers. They are going under contract within their first 30 days on the market, and then closing over the subsequent 30 days. This shift gives both buyers and sellers the necessary breathing room to make sane, calculated financial decisions instead of rushed compromises.
A Healthy Year-Over-Year Plateau (And Who is Missing)
When we step back and compare Q2 2026 to the same period last year (Q2 2025), our local market is showing an incredibly stable, mild deceleration. Median prices are down just 1.3% year-over-year (from $349,325), and total transaction volume softened by 3.7% (a drop of about $38 million).
While select ultra-high-end pockets like the Downtown Historic District saw a slightly sharper dip than that 1.3% average, the broader plateau makes perfect sense when you look at exactly who is currently missing from the marketplace. We closed 58 fewer homes this quarter than we did during the same timeframe last year, and that missing block is split cleanly into two groups:
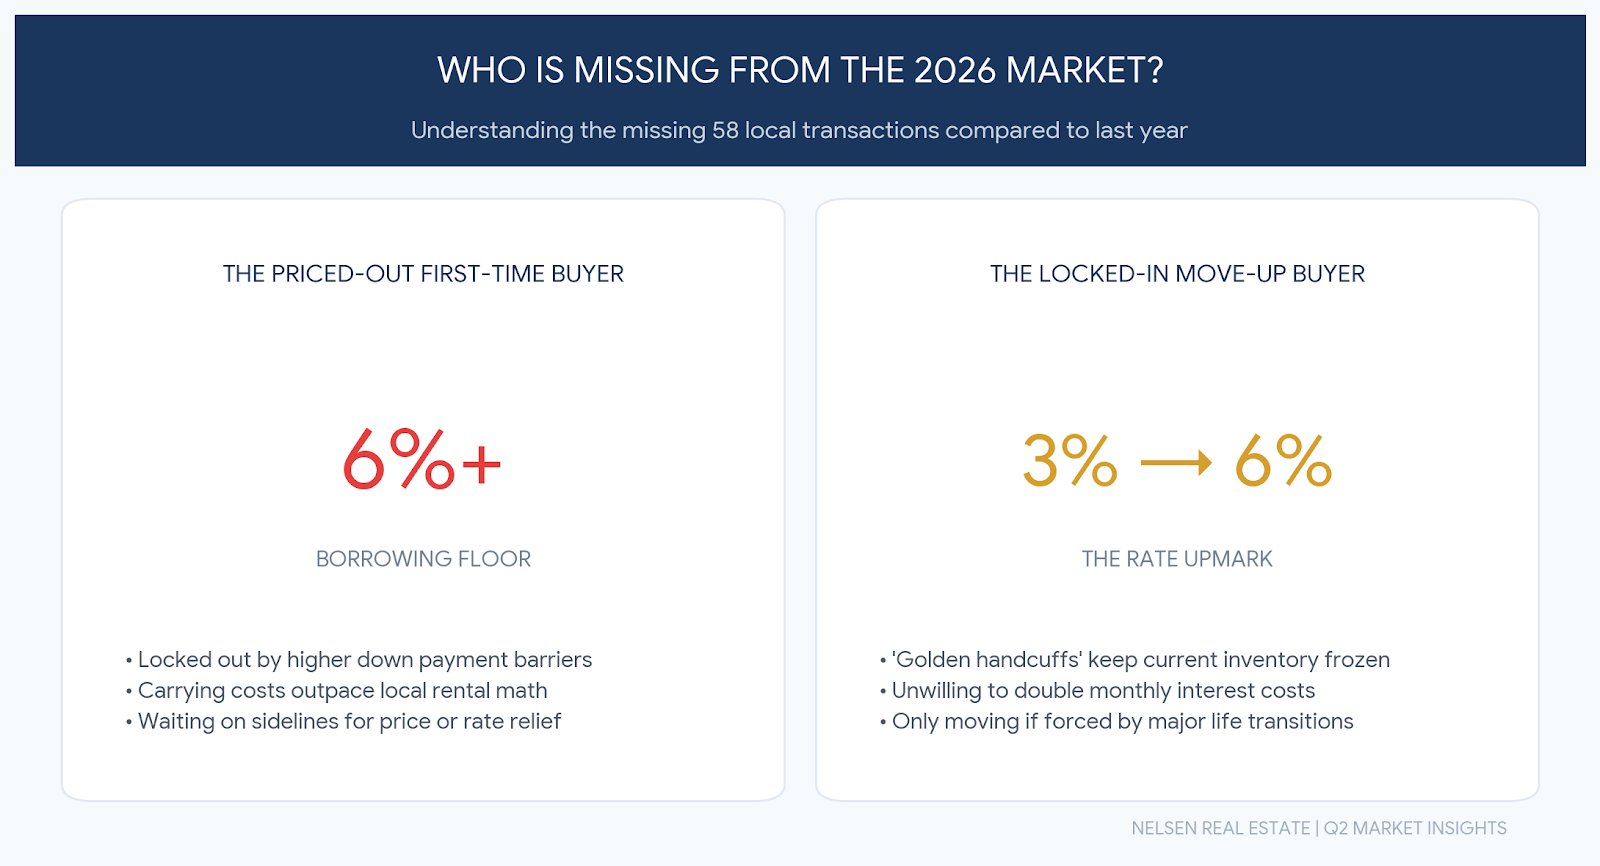
The Priced-Out First-Time Buyer (50%): Younger buyers who have simply been squeezed out of the market by the current 6%+ borrowing floor, where monthly carrying costs no longer align with entry-level numbers.
The Locked-In Move-Up Buyer (50%): Existing homeowners sitting on "golden handcuffs." They are completely unwilling to trade in their current 3% or 4% mortgage rate for a 6% rate unless a major milestone life transition absolutely forces their hand.
The Bottom Line
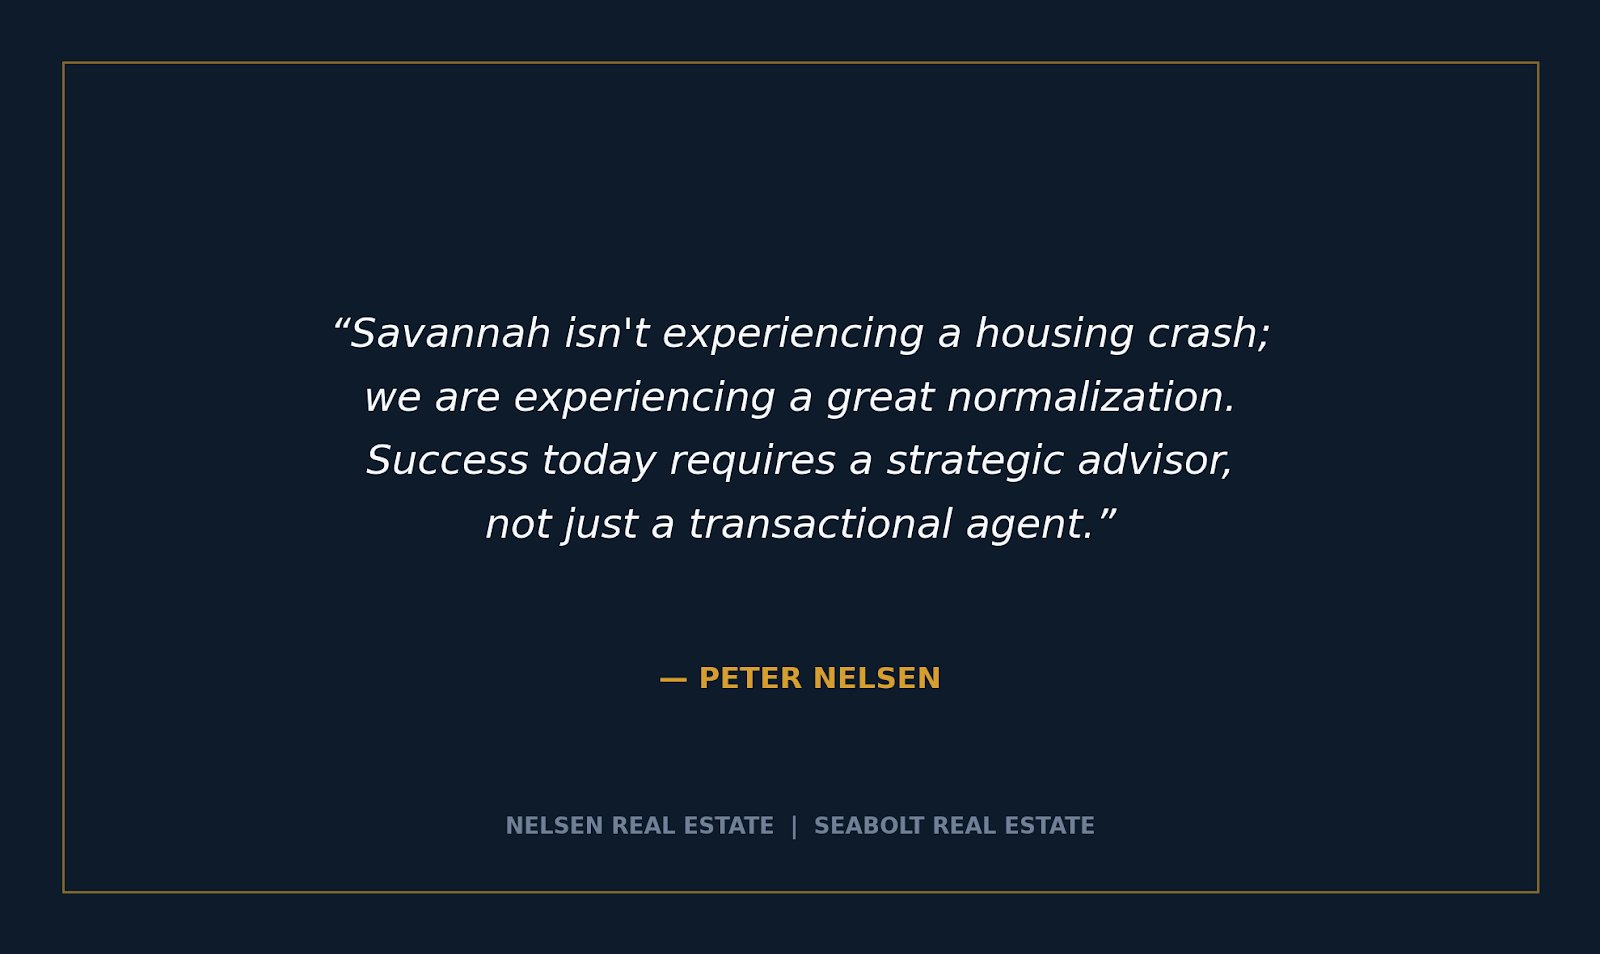
Savannah isn’t experiencing a housing crash; we are experiencing a great normalization.
In a real estate landscape where patience is required, inventory is expanding, and borrowing costs are real, success comes down to hyper-local pricing strategy for sellers and finding turnkey certainty for buyers. Navigating this environment requires a strategic advisor who understands the data, not just a transactional agent who relies on the MLS.
We control the process; you make the decisions. If you are trying to figure out how to make your next move line up with today's financial realities, let’s grab a coffee and look at the options.
Peter Nelsen is the Principal of Nelsen Real Estate, delivering data-driven market intelligence and bespoke brokerage services across the Savannah Lowcountry.